Understanding Surface Roughness: Concepts and Measurement Techniques
Imagine running your fingers across two seemingly identical metal surfaces, only to feel a stark contrast in texture. This subtle…
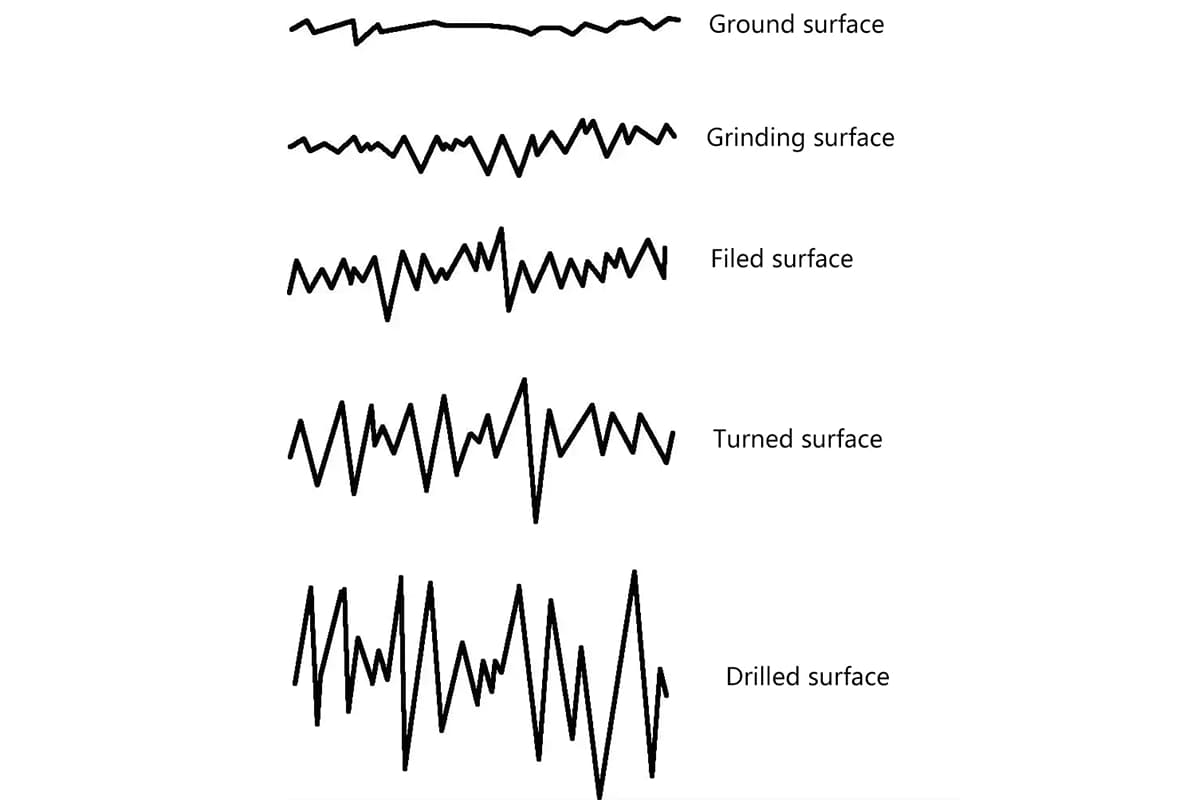
Different processing methods result in different levels of flatness on the processed surface, as shown in Figure 1.
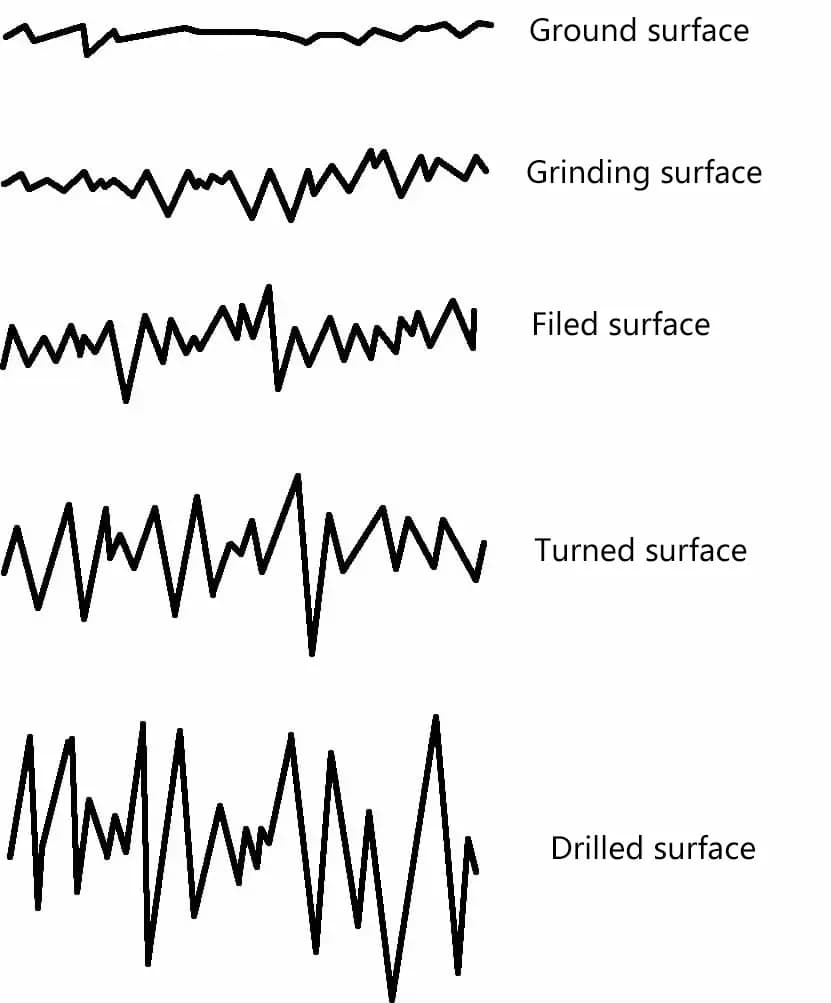
Regardless of the processing method used, the surface of the parts will always have traces of micro unevenness composed of small spacing and peaks and valleys, which describe the degree of height and spacing condition of these peaks and valleys. This micro-geometric characteristic is called surface roughness. It can reflect the micro-geometric shape error on the surface of the part after processing. The relationship between surface roughness and the performance of parts is as follows:
For surfaces of parts with fitting requirements, the compatibility properties will be affected by the surface roughness. For example, in clearance fits, if the surface roughness value is too high, it is prone to wear, causing the clearance to increase rapidly, thereby changing the compatibility properties, especially in cases of small part sizes and tolerances, this effect is more pronounced.
Similarly, in interference fits, if the surface roughness value is too high, it will reduce the actual effective interference amount, thereby reducing the connection strength. Therefore, improving the surface quality of parts can enhance the stability of clearance fits or the connection strength of interference fits, thereby better meeting the usage requirements of the parts.
When two uneven surfaces come into contact, the surface peaks touch first, reducing the actual effective contact area, increasing the pressure on the contact parts, and causing the peaks to be squeezed, deformed, or even broken. In the case of clearance fits, the action between the peaks will form frictional resistance, causing the parts to wear. Generally, the rougher the surface, the greater the friction coefficient, the greater the frictional resistance, the more energy consumed by friction, and the faster the parts wear.
However, in some cases (such as the fitting of sliding bearings and hydraulic guide surfaces), if the surface is too smooth, it is not conducive to the storage of lubricating oil, forming semi-dry friction or even dry friction, sometimes even increasing the adhesion force of the part contact surfaces, thereby increasing the friction coefficient and exacerbating wear. Therefore, choosing the appropriate surface roughness can effectively reduce the friction and wear of parts.
If the surface of the parts is rougher, corrosive substances are more likely to accumulate in the valleys and gradually penetrate into the surface layer of the metal material, forming surface corrosion. Therefore, reducing the surface roughness value of parts can improve their corrosion resistance.
When parts are subjected to alternating loads, indentations on the surface can easily form stress concentration phenomena, increasing the load on the parts, reducing their fatigue strength, and possibly leading to fatigue fracture due to stress concentration. Therefore, special attention should be paid to improving the surface quality of grooves and step fillets during processing to increase the fatigue strength of parts.
The rougher the surface of the parts, the smaller the actual contact area between the surfaces, the greater the force per unit area, the greater the plastic deformation at the peak tops, reducing the contact stiffness, thereby affecting the machine’s working accuracy and vibration resistance.
Uneven surfaces can cause gas or liquid to leak through gaps in surface contact. The rougher the surface, the worse the sealing of the joint surface. Therefore, reducing the surface roughness value can improve the sealing performance of the parts.
In summary, surface roughness directly affects the performance and lifespan of mechanical parts, therefore, a reasonable selection and determination of the surface roughness values for parts should be made.
The shape characteristics and processing methods of surface roughness are shown in Table 1.
Table 1 Shape characteristics and processing methods of surface roughness
| Surface roughness Ra/μm | Surface shape characteristics | Processing methods |
| 50 | Visible tool marks | Rough turning, boring, drilling, planing |
| 25 | Slightly visible tool marks | Rough turning, planing, vertical milling, horizontal milling, drilling |
| 12.5 | Visible processing traces | Turning, boring, planing, drilling, horizontal milling, vertical milling, filing, rough reaming, grinding, gear milling |
| 6.3 | Slightly visible processing traces | Turning, boring, planing, milling, scraping 1~2 points/cm², broaching, grinding, filing, hydraulic, gear milling |
| 3.2 | Invisible processing traces | Turning, boring, planing, milling, reaming, broaching, grinding, rolling, scraping 1~2 points/cm², gear milling |
| 1.6 | Identifiable direction of processing traces | Turning, boring, broaching, grinding, vertical, milling, reaming, scraping 3~10 points/cm², rolling |
| 0.8 | Barely identifiable direction of processing traces | Reaming, grinding, scraping 3~10 points/cm², boring, broaching, rolling |
| 0.4 | Unidentifiable direction of processing traces | Buff grinding, grinding, polishing, superfinishing |
| 0.2 | Matte surface | Superfinishing |
| 0.1 | Bright glossy surface | Superfinishing |
| 0.05 | Mirror-like glossy surface | |
| 0.025 | Misty mirror surface | |
| 0.012 | Mirror surface |
As shown in Table 2.
Table 2 Graphic symbols and meanings of surface roughness
| Symbol | Meaning and explanation |
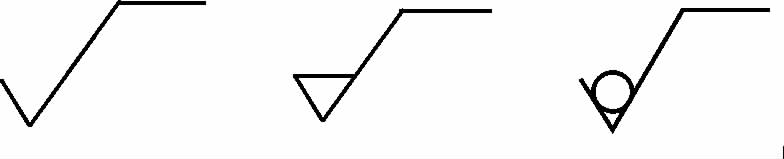
 | Basic symbol, indicating the specified surface can be obtained by any process. When surface roughness parameters or related explanations (such as surface heat treatment, local heat treatment conditions) are not annotated, it is only applicable to simplified code marking and cannot be used alone without supplementary explanations |
| Extended symbol for material removal, basic symbol plus a dash, indicating the specified surface is obtained by removing material, such as turning, milling, drilling, grinding, shearing, polishing, etching, EDM, gas cutting, etc. | |
 | Extended symbol for non-material removal, basic symbol plus a circle, indicating the specified surface is obtained by non-material removal methods, such as casting, forging, stamping deformation, hot rolling, cold rolling, powder metallurgy, etc.; or is used to maintain the original supply condition of the surface (including maintaining the condition of the previous process) |
 | Complete symbol, when supplementary information on surface structure is required to be marked, a horizontal line should be added on the long side of the above three graphic symbols |
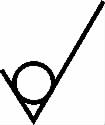
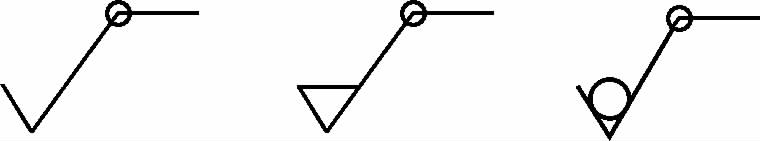 | Graphic symbols for the surfaces of the workpiece profile, when the surfaces forming a closed profile in a certain view of the drawing have the same surface structure requirements, a circle should be added on the complete graphic symbol, marked on the closed profile line of the workpiece in the drawing. If marking may cause ambiguity, each surface should be marked separately |
As shown in Table 3.
Table 3 Composition of the complete graphic symbol for surface structure
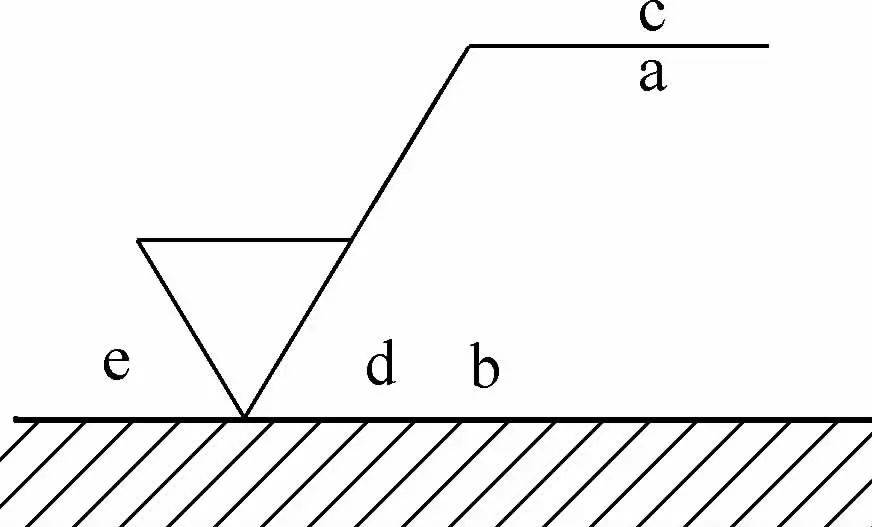 | a | Annotate the single requirement of surface structure. Mark the surface structure parameter code, limit values, and transmission band or sampling length. To avoid errors, a space should be inserted between the parameter code and limit values. After the transmission band or sampling length, there should be a slash “/”, followed by the surface structure parameter code, and finally the value |
| b | When annotating two or more surface structure requirements, write the first surface structure requirement at position a, and the second surface structure requirement at position b. If annotating the third or more surface structure requirements, the graphic symbol should be expanded vertically to leave enough space. When expanding the graphic symbol, the positions of a and b move up accordingly | |
| c | Annotate the machining method. Write the machining method, surface treatment, coating, or other processing requirements, such as turning, grinding, plating, etc., surface processing methods | |
| d | Annotate the surface texture and direction, such as “=”, “X”, “M”, etc. | |
| e | Annotate the machining allowance. Write the required machining allowance, giving the value in millimeters |
As shown in Table 3-7.
Table 4 Examples of surface structure code marking
| Symbol | Meaning Explanation |
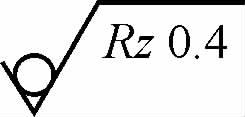 | Indicates no material removal, unidirectional upper limit value, default conveyor belt, R profile, maximum height of surface roughness 0.4μm, evaluation length of 5 sampling lengths (default), “16% rule” (default) |
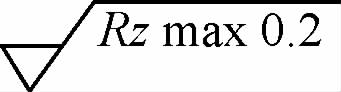 | Indicates material removal, unidirectional upper limit value, default conveyor belt, R profile, maximum height of surface roughness maximum value 0.2μm, evaluation length of 5 sampling lengths (default), “maximum rule” |
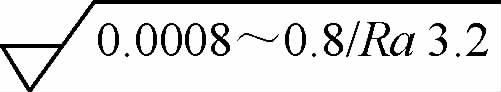 | Indicates material removal, unidirectional upper limit value, conveyor belt 0.008~0.8mm, R profile, arithmetic mean deviation 3.2μm, evaluation length of 5 sampling lengths (default), “16% rule” (default) |
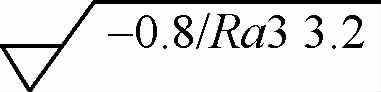 | Indicates the removal of material, unidirectional upper limit value, conveyor belt: sampling length 0.8μm (λ s default 0.0025mm), R profile, arithmetic mean deviation 3.2μm, evaluation length includes 3 sampling lengths, “16% rule” (default) |
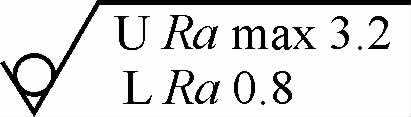 | Indicates that removal of material is not allowed, bidirectional limit values, both limit values use the default conveyor belt, R profile. Upper limit value: arithmetic mean difference 3.2μm, evaluation length is 5 sampling lengths (default), “maximum rule”; Lower limit value: arithmetic mean deviation 0.8μm, evaluation length is 5 sampling lengths (default), “16% rule” (default) |
As shown in Table 3-8.
Table 5 Comparison of old and new standard surface structure graphic symbols
Serial numberVersion of GB/T 1311983 (1st edition) ①1993 (2nd edition) ②2006 (3rd edition) ③Example illustrating the main issue1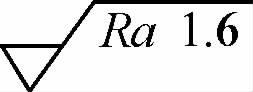 Ra only adopts the “16% rule”2 Ra only adopts the “16% rule”2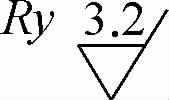 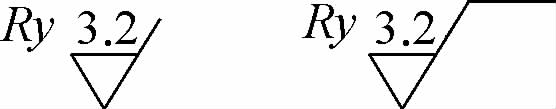 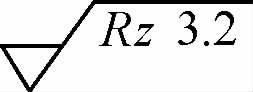 Parameters other than Ra’s “16% rule”3④ Parameters other than Ra’s “16% rule”3④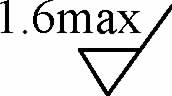 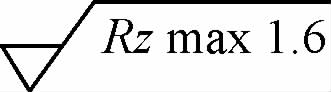 Maximum rule4 Maximum rule4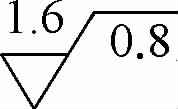 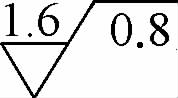 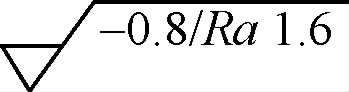 Ra plus sampling length5④④ Ra plus sampling length5④④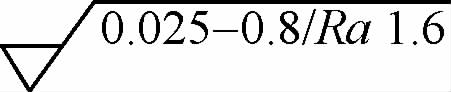 Conveyor belt6 Conveyor belt6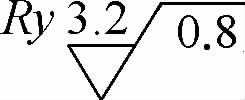 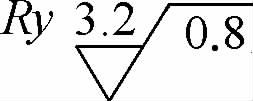 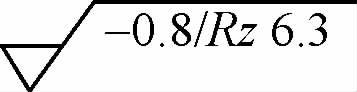 Parameters other than Ra and sampling length7 Parameters other than Ra and sampling length7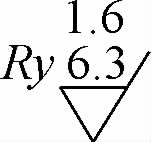 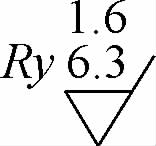 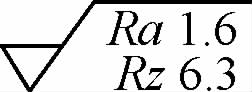 Ra and other parameters8④ Ra and other parameters8④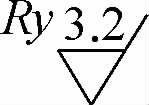 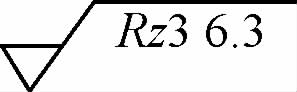 If the number of sampling lengths in the evaluation length is not 59④④ If the number of sampling lengths in the evaluation length is not 59④④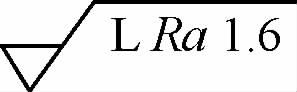 Lower limit value10 Lower limit value10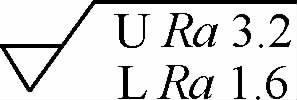 Upper and lower limit values Upper and lower limit values |
① Neither a default value is defined nor any other details, especially: no default evaluation length; no default sampling length; no “16% rule” or “maximum rule”.
② The default values and rules defined in GB/T 3505—1983 and GB/T10610—1989 are only used for parameters Ra, Ry, and Rz (10-point height). In addition, there is an inconsistency in parameter notation in GB/T 131—1993, where the standard text requires the second letter of the parameter code to be subscripted, but in all tables, the second letter is lowercase, while at that time all other surface structure standards used subscript.
③ The new Rz is defined as the original Ry, and the symbol for the original Ry is no longer used.
④ Indicates that the item does not exist.
The surface roughness achievable by different processing methods is shown in Table 6.
Table 6 Surface roughness achievable by different processing methods
| Processing method | Surface roughness Ra/μm | ||||||||||||||
| 0.012 | 0.025 | 0.05 | 0.10 | 0.20 | 0.40 | 0.80 | 1.60 | 3.20 | 6.30 | 12.5 | 25 | 50 | 100 | ||
| Sand casting, shell molding | |||||||||||||||
| Metal mold casting | |||||||||||||||
| Centrifugal casting | |||||||||||||||
| Precision casting | |||||||||||||||
| Investment casting | |||||||||||||||
| Pressure Casting | |||||||||||||||
| Hot Rolling | |||||||||||||||
| Die Forging | |||||||||||||||
| Cold Rolling | |||||||||||||||
| Extrusion | |||||||||||||||
| Cold Extrusion | |||||||||||||||
| Scraping | |||||||||||||||
| Planing | Rough | ||||||||||||||
| Fine | |||||||||||||||
| Broaching | |||||||||||||||
| Drilling | |||||||||||||||
| Reaming | Rough | ||||||||||||||
| Fine | |||||||||||||||
| Diamond Boring | |||||||||||||||
| Boring | Rough | ||||||||||||||
| Semi-Fine | |||||||||||||||
| Fine | |||||||||||||||
| Reaming | Rough | ||||||||||||||
| Semi-Fine | |||||||||||||||
| Fine | |||||||||||||||
| Broaching | Semi-Fine | ||||||||||||||
| Fine | |||||||||||||||
| Roll Milling | Rough | ||||||||||||||
| Semi-Fine | |||||||||||||||
| Fine | |||||||||||||||
| End milling | Rough | ||||||||||||||
| Semi-Fine | |||||||||||||||
| Fine | |||||||||||||||
| Diamond turning | |||||||||||||||
| Turning external circle | Rough | ||||||||||||||
| Semi-Fine | |||||||||||||||
| Fine | |||||||||||||||
| Turning end face | Rough | ||||||||||||||
| Semi-Fine | |||||||||||||||
| Fine | |||||||||||||||
| Grinding external circle | Rough | ||||||||||||||
| Semi-Fine | |||||||||||||||
| Fine | |||||||||||||||
| Grinding plane | Rough | ||||||||||||||
| Semi-Fine | |||||||||||||||
| Fine | |||||||||||||||
| Honing | Plane | ||||||||||||||
| Cylinder | |||||||||||||||
| Polishing | Rough | ||||||||||||||
| Semi-Fine | |||||||||||||||
| Fine | |||||||||||||||
| Polishing | General | ||||||||||||||
| Fine | |||||||||||||||
| Rolling Polishing | |||||||||||||||
| Ultra-precision Machining | |||||||||||||||
| Chemical Polishing | |||||||||||||||
| Electrolytic Polishing | |||||||||||||||
| Electrical Discharge Machining | |||||||||||||||